

Platform
The whole portfolio in view. Every number carrying its evidence.
ActionWell keeps a producing-well population under continuous, governed review and hands engineers decision-ready cases. Every product screen on this page shows an illustrative demo portfolio, not a customer deployment.
Product views
Four views of one governed state.

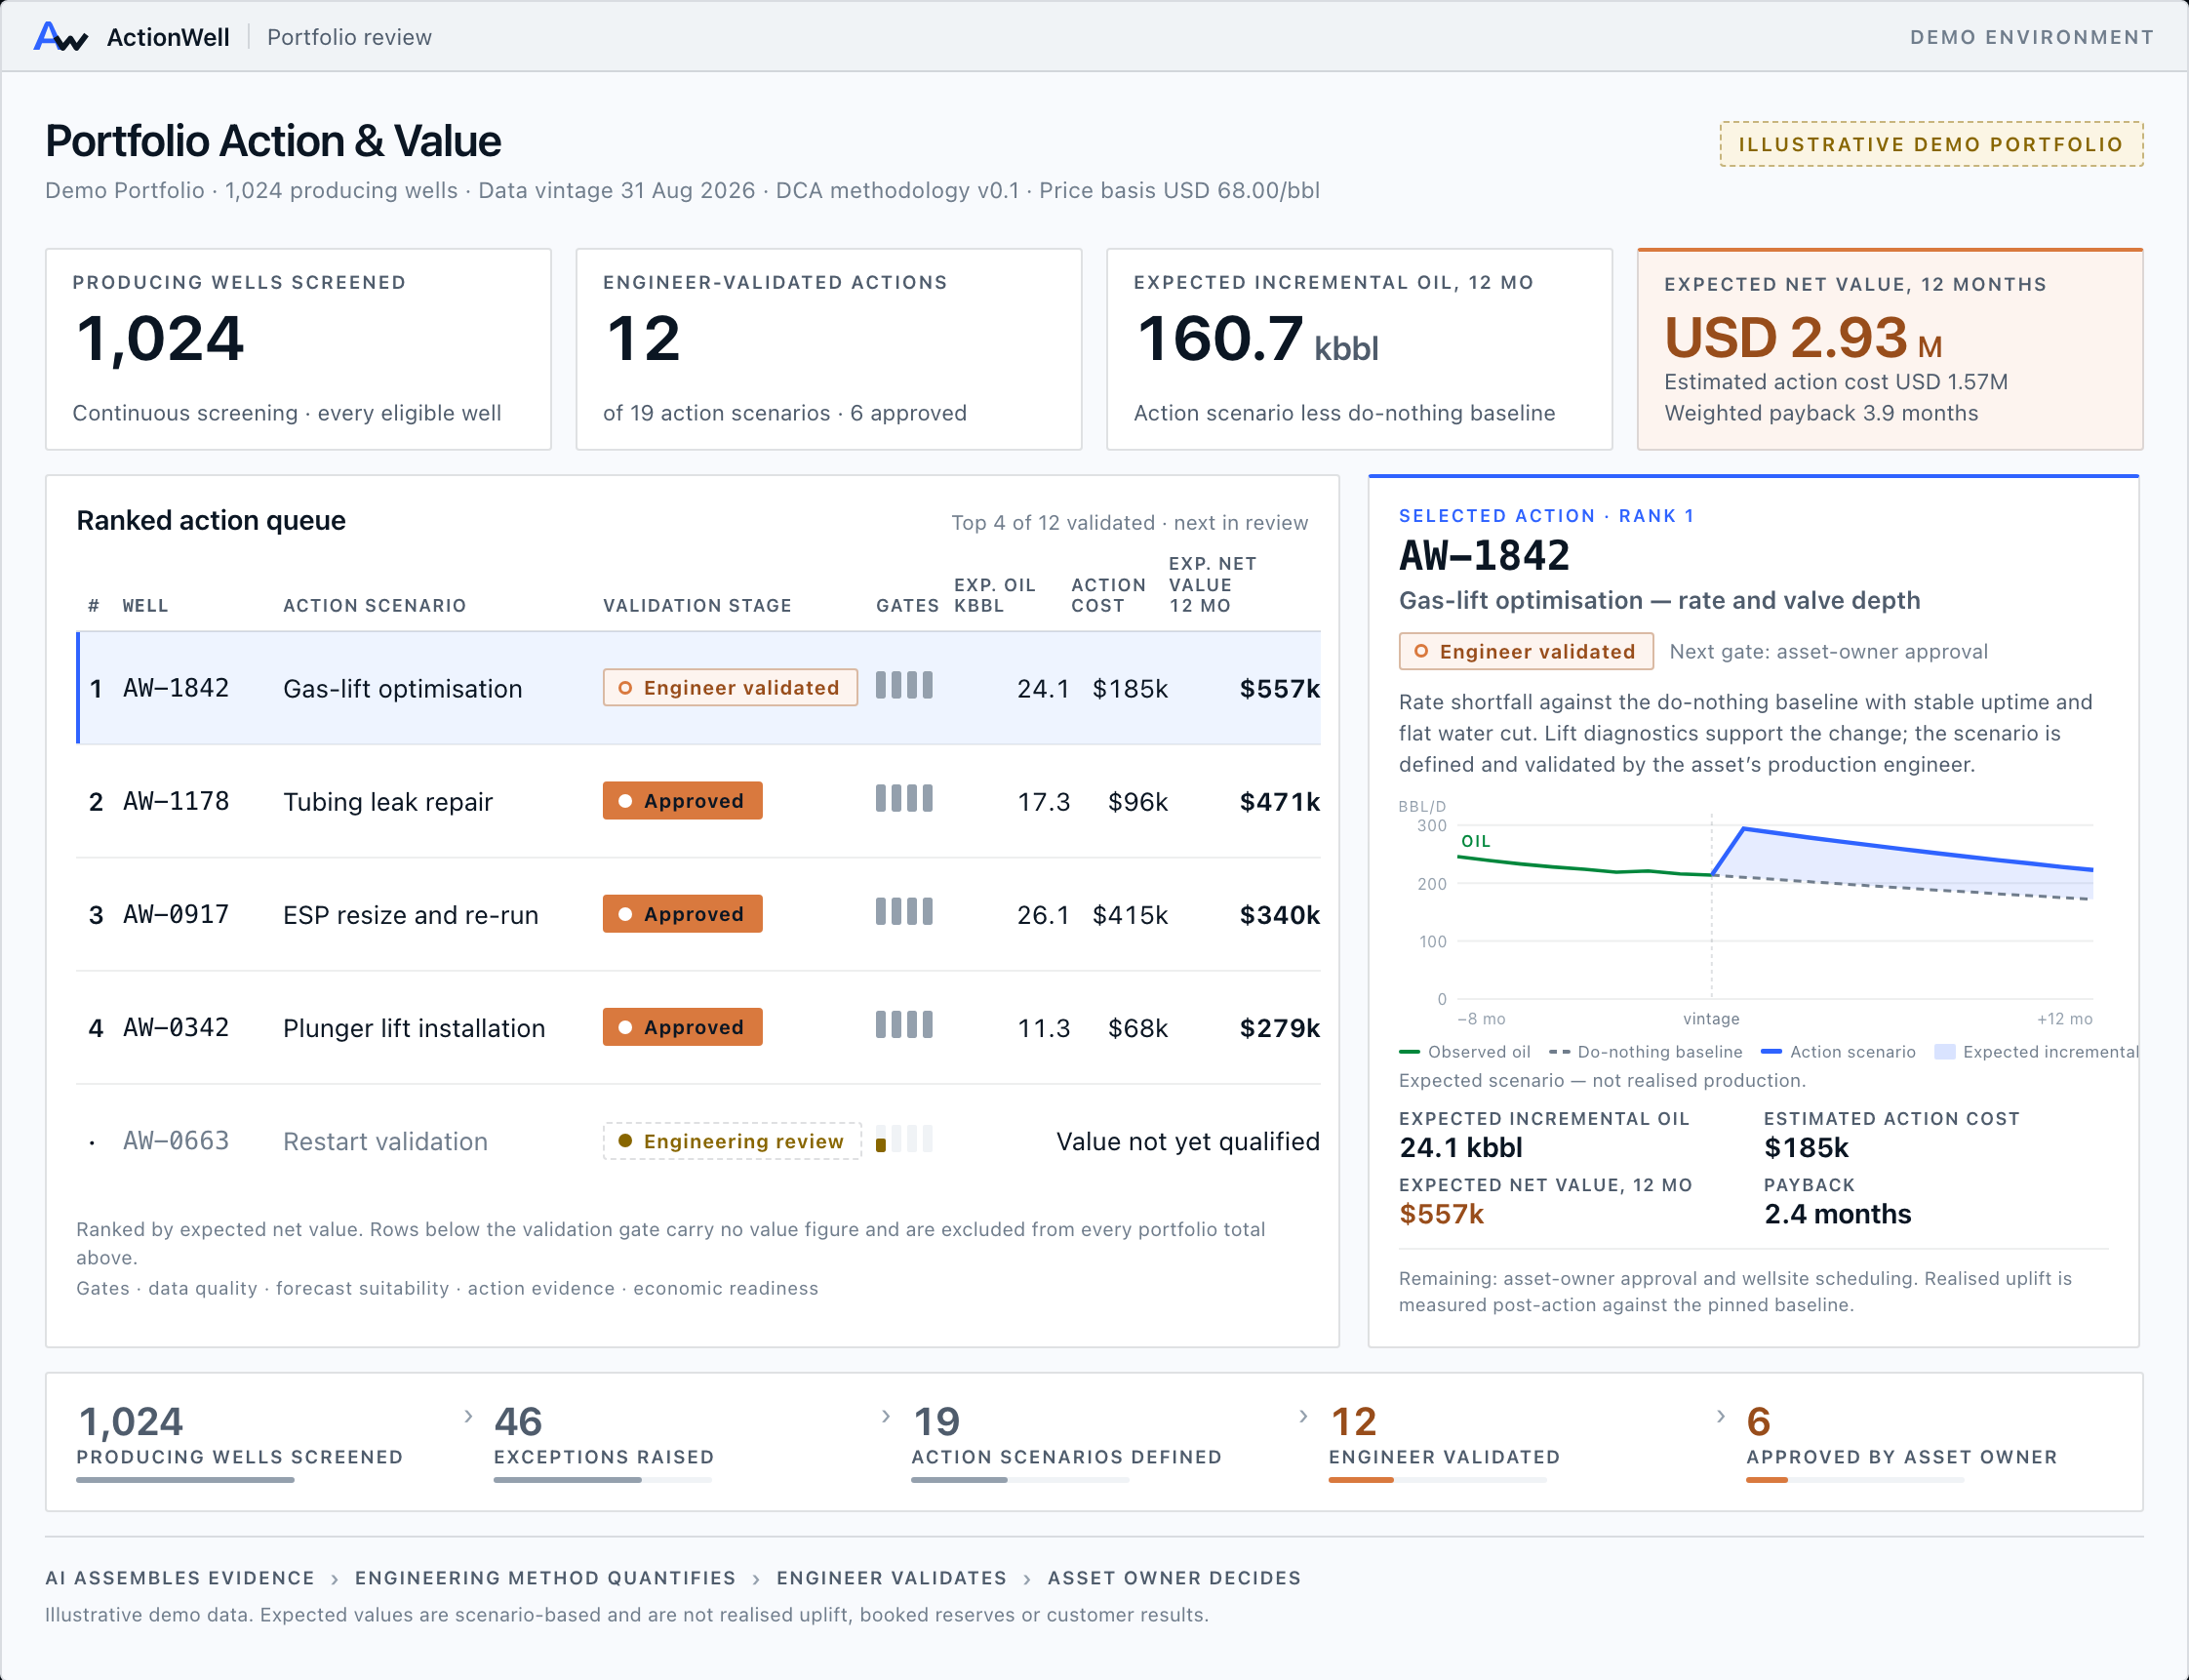
Portfolio review
The portfolio screen keeps the whole population in one frame: how many wells were screened this cycle, how many exceptions were raised, how many action scenarios exist, how many an engineer has validated and how many an asset owner has approved. The four headline figures are pinned to a data vintage, a methodology version and a price basis, so every number on the screen can be reproduced.
- Screened, validated, expected volume and expected value in one glance
- Rows below the validation gate carry no value figure
- The most valuable action is the one still awaiting a human decision

Well dossier
Each dossier compares the well's do-nothing baseline with an engineer-defined action scenario and prices the difference. The chart starts at zero so the incremental band is never visually exaggerated, the scenario is labelled as expected rather than realised, and the next gate is named. The rationale is written by the asset's production engineer, not generated.
- Baseline dashed and neutral; the scenario is the one line that is a claim
- Cost, expected value and payback in the same frame as the volume
- Remaining validation items stay visible until closed
Decline steepening against the do-nothing baseline Derived
Active-day coverage 97.6% over the review window Derived
Water cut flat at 38% — no phase-shift signature Measured
Gas-lift rate and valve depth below design point Engineer note
Illustrative evidence panel · demo portfolio
Evidence and operational context
The evidence panel labels each item by its state and links it to the record it came from. Operating context — shut-ins, restarts, workovers, lift and choke changes, downtime — sits beside the production series with its provenance shown, and an engineer's own note is recorded as exactly that.
- Every value carries its evidence state: measured, derived, forecast, assumed, engineer note
- Evidence that cannot be traced to a source is not shown as evidence
- The hypothesis is the engineer's, and it is labelled as a note, not a finding


Economics and prioritisation
Where the operator supplies one declared economic condition set — price basis, incremental cash operating cost, taxes and ownership — ActionWell computes the economic limit as a cash-flow result and an expected net value per validated action. Price, cost and policy sensitivities are reported separately. Value figures always sit beside history length and forecast confidence, never under mixed assumptions.
- Expected net value over a stated horizon, undiscounted; never labelled NPV
- Identified value is a queue-level opportunity measure, not realised value
- Wells are never compared or summed under different economic assumptions
Capabilities and outputs
Seven things the platform does, and what each one is not.
Continuous portfolio review
Every well in the declared population is re-evaluated as each new data vintage arrives, not only the wells someone chose. Each run produces an eligibility verdict and a data-quality profile per well, diffs the new history against the previous vintage, and reports restatements as data events rather than forecast errors.Absence from a queue is never a clean bill of health, and no well disappears without a named reason.
Portfolio action queue
Wells that warrant attention are presented in separately ordered review queues — data problems, baseline problems, deviations, identified value, stale baselines — each on a single declared key with its criterion printed. There is no combined score, because a composite is an unstated weighting that hides the worst-data wells.A high rank is evidence that an engineer should look, never evidence of what they will find.
Decision-ready well dossier
One versioned object per well at one vintage: data-quality profile, event timeline, candidate segmentations with the diagnostic plot, the candidate-model comparison, backtest evidence, the expected baseline with its conditions, uncertainty by component, deviations, hypotheses and the engineer's recorded verdicts. Every number resolves to the step and vintage that produced it.The dossier stays valid with any generated narrative removed. It is not an approval and not a work order.
Production truth and governed baseline
The foundation is an expected baseline per eligible well: what it would produce if operated as it has been, from an accepted model on a qualified stable segment, approved by a named engineer before publication. Immutable once published, pinned to its data vintage, code version and policy version, and superseded rather than edited.A well the method cannot analyse receives a dossier explaining why, not a number.
Evidence and operational context
Evidence assembled for a case is labelled by its state — measured, derived, forecast, assumed, engineer note — and linked to the record it came from. Operating context — shut-ins, restarts, workovers, lift and choke changes, downtime — is carried beside the production series with its provenance stated: filed, supplied by the operator, taken from a document, or inferred and not yet confirmed. An item that cannot be traced to a source is not presented as evidence.Attributing a deviation to an operating cause belongs to the operational-causality layer, which is product direction, not a current output. An empty operating record is evidence about the record, not about the well.
Economics and prioritisation
With one declared economic condition set from the operator, the platform computes the economic limit as a cash-flow result, remaining production to a named truncation, and identified value — the expected net value of validated actions, taken together at queue level. Price, cost and policy sensitivities are reported separately, and value figures are always shown beside history length, forecast confidence and calibration status.Identified value is a queue-level opportunity measure. It is not realised value.
Outcome feedback
Published baselines are tracked against realised production on the same measures used in backtesting, so accuracy and interval coverage are measured on each operator's own population rather than assumed. None has been measured yet, and none is quoted. Breaches route to a named engineer for classification before any action.Where an intervention is made, the do-nothing baseline is frozen before the job, and realised uplift is measured against it on a ledger kept separate from identified value.
Product structure
Four layers on one governed asset state.
The design intent is that the same governed state deepens as more evidence arrives, without restarting the foundation. Only the first layer is being built today; the rest is stated direction, not delivered capability.
Production truth
What changed?A governed history, a qualified do-nothing baseline per eligible well and, with operator economics, an economic limit and identified value — all engineer-approved and vintage-pinned.
Current focusOperational causality
What may explain it?Operating events, downtime and document evidence set beside deviations, so that hypotheses about operating loss can be recorded, tested and owned by an engineer.
Product directionReservoir awareness
Is it recoverable?Pressure, injection and surveillance evidence added to the same state, so the applicability of decline analysis is tested rather than assumed and recovery questions can be posed.
Product directionIntegrated optimisation
What happens next?Subsurface, wells and facilities connected so that feasible actions can be assessed against constraints, with the engineer validating every candidate.
Product direction
Next step
See it on your own well population.
A validation starts from the production history you already have, and it can end in a no: every well in scope comes back accounted for, including the ones the method refuses.